
Google drives tons of traffic to most websites and it can also steer how we create, optimize and measure a website’s true success. Google made an announcement that they have a new ranking signal named: Web Vitals or Core Web Vitals which will go into effect in May 2021. Their goal is to make the web better overall and have made several changes over the last few years.
Web Vitals will evolve over time according to Google but it will focus on three main aspects of user experience.
- Loading
- Interactivity
- Visual Stability
Please keep in mind that the new Core Web Vitals is one of MANY ranking signals in the Google Search Engine algorithm. Your site should still be optimized for ranking well.
NEW UPDATE: Google changed this from May 2021 to the beginning to mid-June 2021. However, page experience won’t play its full role as part of those systems until the end of August 2021. (read the article here)
How Your Site is Measured by Google
- Performance Audits for metrics like first paint and time to interactive to determine lag. (Web Vitals)
- Best Practices Looks for everything from HTTPS usage to correct image aspect ratios.
- SEO Checks for best practices to ensure your site is discoverable.
- Accessibility Checks for common issues that may prevent users from accessing your content.
- All tests are run using a simulated mobile device, throttled to a fast 3G network & 4x CPU slowdown.
Google Defines Web Vitals as the following:
Optimizing for quality of user experience is key to the long-term success of any site on the web. Whether you’re a business owner, marketer, or developer, Web Vitals can help you quantify the experience of your site and identify opportunities to improve.
~ The Google
Each aspect of Google’s Web Vitals can be measured by their new algorithm and each one has a certain threshold. For each of the metrics below, you must ensure you’re hitting the recommended target for most of your users. A good threshold to measure is the 75th percentile of page loads, segmented across mobile and desktop devices. Do you now long for the days when just blogging was enough?
Core Web Vitals
Loading (aka Largest Contentful Paint (LCP))
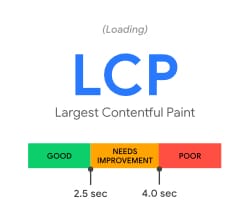
Loading is in layman’s terms. Google has coined this new term as Largest Contentful Paint or LCP, which measures loading performance.
To provide a good user experience, LCP should occur within 2.5 seconds of when the page first starts loading.
Measuring LCP is all about speed and being at or under 2.5 secs. If your website loads in a time above the 2.5 seconds threshold but under the 4.0 seconds time you will be in the Orange. Anything above 4.0 seconds puts you in the Red. If your website is in the Red Zone you should consider fixing this in the immediate future.
- Good – Under 2.5 sec
- Needs Improvement – 2.5 to 4.0 sec
- Poor – Above 4.0 sec
Interactivity (aka First Input Delay (FID))
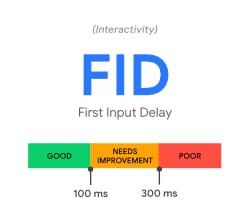
Interactivity makes more sense then the “First Input Delay” or FID but Google wanted to stick with tree letter acronyms. First Input Delay or FID, measures interactivity.
To provide a good user experience, pages should have a FID of less than 100 milliseconds.
Measuring FID helps measure your user’s first impression of your site’s interactivity and responsiveness. For example, when a user clicks a link or taps on a button it measures the time when the browser actually is able to begin processing the event handlers in response to that interaction.
- Good – Under 100 ms
- Needs Improvement – 100 ms to 300 ms
- Poor – Above 300 ms
Visual Stability (aka Cumulative Layout Shift (CLS))
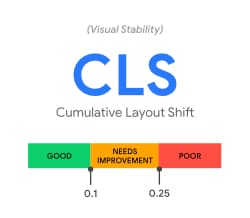
Visual Stability measures how often users experience unexpected layout shifts within the page. This should be defined as Visual Layout shift but Google has gone with Cumulative Layout Shift or CLS for short.
Google provides a great example:
Have you ever been reading an article online when something suddenly changes on the page? Without warning, the text moves, and you’ve lost your place. Or even worse: you’re about to tap a link or a button, but in the instant before your finger lands—BOOM—the link moves, and you end up clicking something else!
~ The Google
Measuring CLS is a little harder to grasp than the previous two measurements because it gets very technical very quickly.
To calculate the layout shift score, the browser looks at the viewport size and the movement of unstable elements in the viewport between two rendered frames. The layout shift score is a product of two measures of that movement: the impact fraction and the distance fraction (both defined below).
layout shift score = impact fraction * distance fraction
An easier way to explain this to think about a huge website menu that we have all come across. You click the menu item and it drops down a column. Again you click what you think is a link to the website you are trying to get to and the menu drops down another column! This can lead to an endless amount of visual instability especially on a mobile phone which would warrant a bad CLS score.
- Good – Under 0.1
- Needs Improvement – 0.1 to 0.25
- Poor – Above 0.25
For a full overview of Google’s Web Vitals with a detailed explanation and fancy images, please see their blog post at https://web.dev/vitals/.
Core Web Vitals is just the tip of the iceberg. Typically they only announce a few huge changes over the course of a year but this time the Web Vitals has its own public changelog to show all of us what they are looking for. This measurement will evolve into something bigger each time. See the Web Vitals changelog here https://chromium.googlesource.com/chromium/src/+/master/docs/speed/metrics_changelog/README.md
Measuring Website Success with Core Web Vitals
Google thankfully provides a user-friendly tool which will allow you to see where you stand within about 30 secs. Go to https://web.dev/measure/ and enter in your URL to run an audit. The audit provided will give you a clear report to where your site stands and what you need to do about it.
Example: SimplexStudios.com (this website)
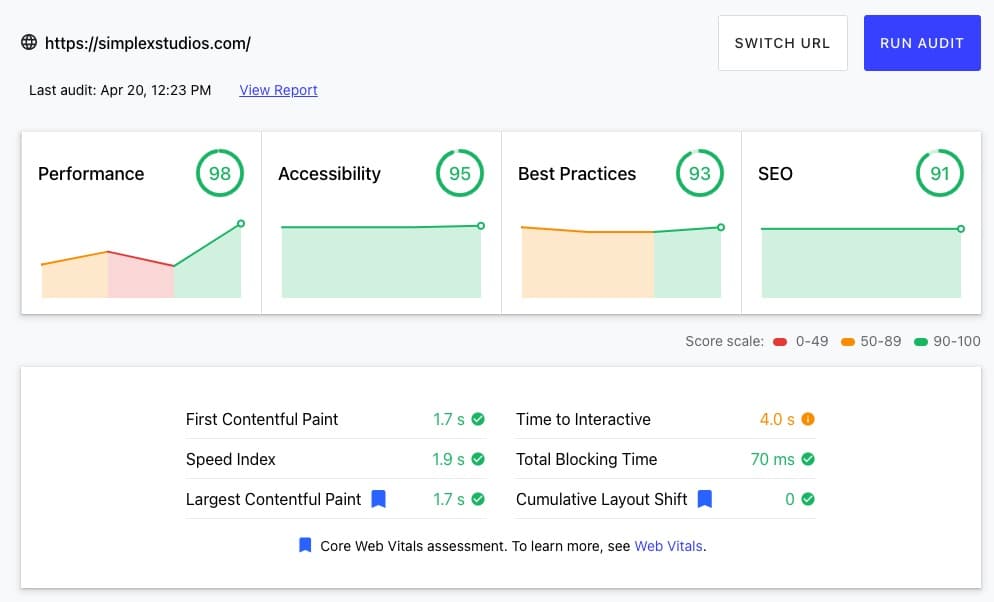
On the performance graph on the left side, we had an initial score of 44, then 61 then 44 to test out what works and what does not work. From here we moved up to 98 which is excellent. Out of the 6 scores under the graph, we have a “Needs Improvement” for Time to Interact at 4.0 secs but we are right on the threshold and have an overall score of GOOD. Most websites that I have tested have a GOOD score for, Accessibility, Best Practices, and SEO. The one that fails each time is the Performance metric.
Below the graph is when the learning curve goes through the roof for most people. Google will make a series of suggestions on how to improve your site’s Web Vitals and overall performance.
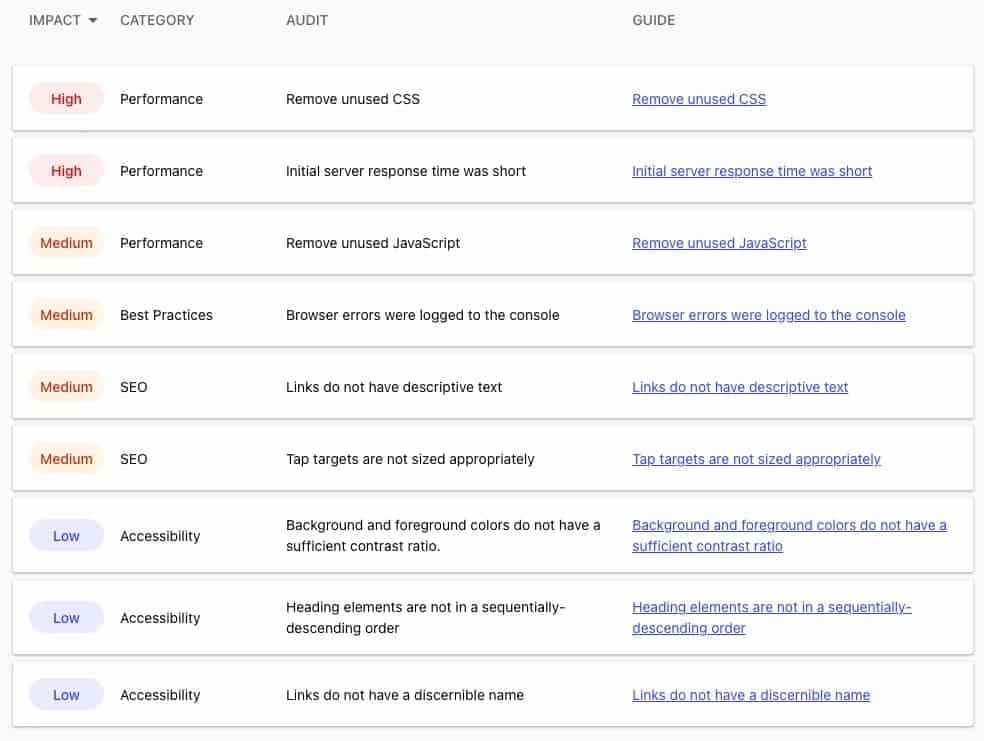
From here you go through the checklist to “improve” your score. Keep in mind that some of these changes should not be completed, as they are a part of the tools used to build the site. For example, we use WordPress and when we minify or change some of the JavaScript or CSS output, it can lead to us breaking the layout and overall look of the site which would, in turn, give us a terrible CLS or Cumulative Layout Shift (CLS) score.
Keep in mind that optimizing your website is an ongoing process and shooting for excellent performance will boost your rankings against your competition and help you rank higher in Google’s Search Engine. Remember your website is always a living document that should always be changing, updated, and moving in the direction your customers expect.
Simplex Studios is committed to helping our clients optimize their websites for the best performance possible. If you need help optimizing your website or have any questions about the blog post above please reach out to us. Contact Simplex Studios.

Have a question about this article? Let us know we would love to help!
Contact Simplex Studios Today!
We provide website design, support, and marketing consulting for all businesses. We use the latest tools to push your businesses forward and help you get in front of your customers.
